How it works
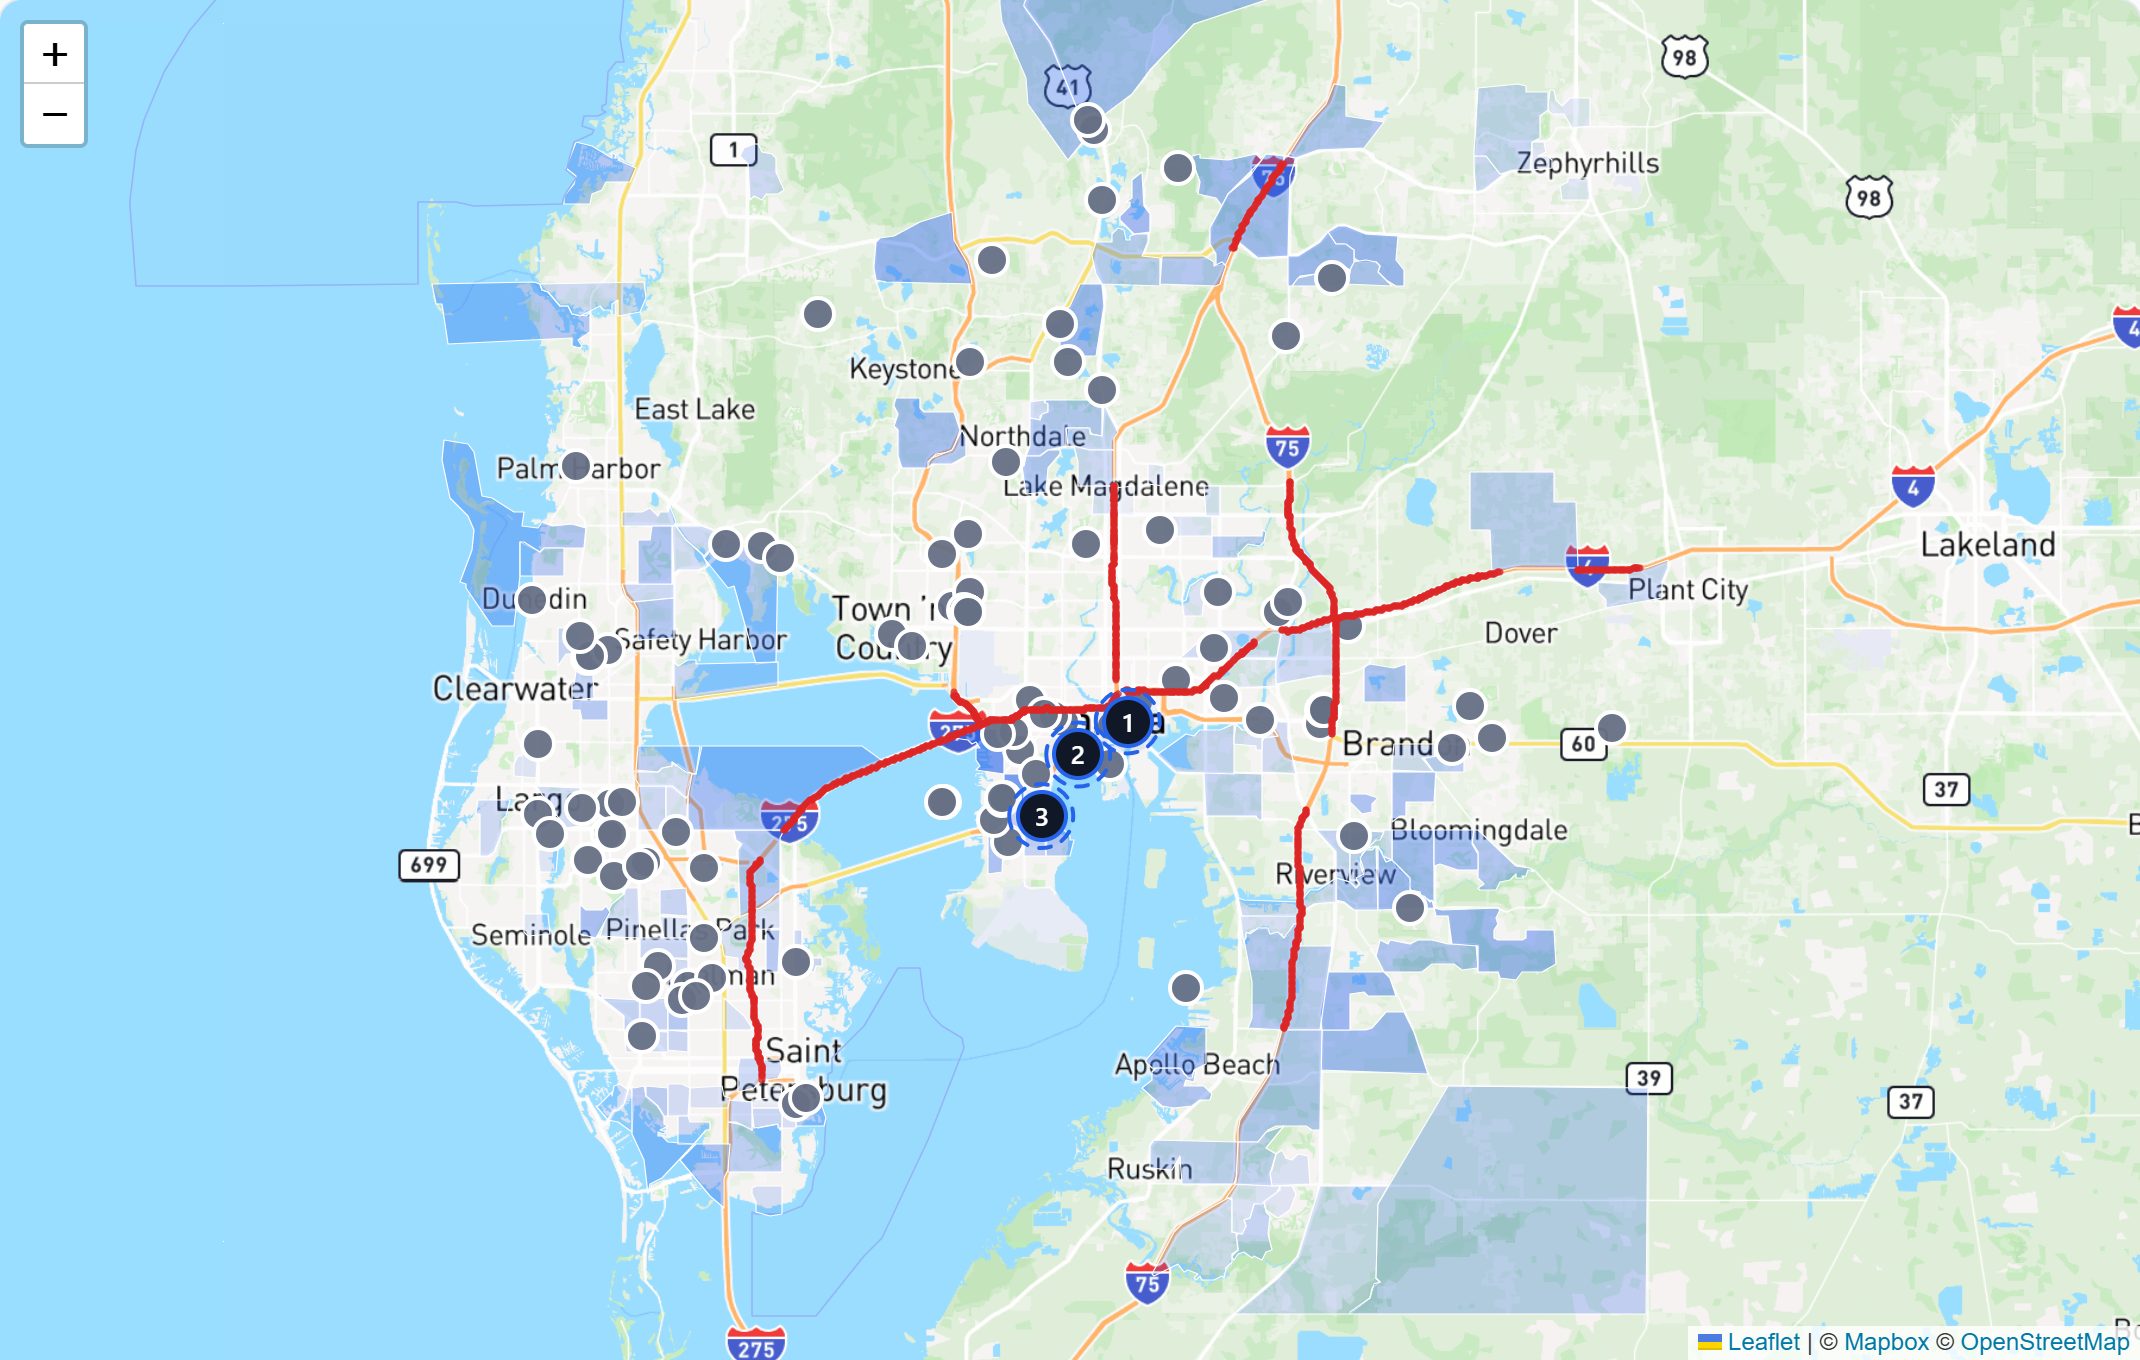
State road departments count cars with real sensors and publish the data every year. We draw it on your map. A location on a 40,000 car road gets seen every day without an ad budget.
Source: State DOT traffic counts, measured yearly.
What you do with it
- Compare two candidate corners by real traffic.
- Price signage value into a lease decision.
- Find the corridor commuters actually use.
How it is built
Traffic counts are measured vehicle volumes published by state transport departments and the federal highway programme, not modelled estimates. A segment reading twenty-eight thousand vehicles a day was counted, on that road, in the stated year.
For any trade that draws from passing traffic, this is often the single most decisive number on the report. Two sites a mile apart in the same neighborhood can differ several times over in the traffic passing the door, and no demographic view will show you that.
Segments are coloured by volume so the arterial pattern of a city is visible at a glance, and each carries its own count and the year it was measured.
What it does not do
Every method has edges. These are the ones worth knowing before you lean on this.
- Coverage varies by state. Some states publish local arterials in detail while the national fallback covers mainly larger roads.
- Counts are annual averages, so they do not describe a rush hour or a seasonal peak.
- Traffic past a door is not the same as customers through it. It is a necessary condition for walk-in trade, not a sufficient one.
Common questions
How recent are the counts?
Each segment shows the year it was measured. Most published data runs a year or two behind, which is normal for physical traffic counting.
Why are interstates excluded from site suggestions?
Because you cannot open a clinic on a motorway. Suggested sites snap to roads a customer can actually turn into.