How this market works
Roofing is the most event-driven trade on this list. A single hail event can pull three years of replacement demand into one season, and a metro that has not been hit in a decade will look quiet on every metric right up until it is not. The report reads hazard exposure by neighborhood alongside the housing data, so a market with real storm risk is visible before the storm.
Underneath the events sits a slow replacement cycle. Asphalt shingle lasts roughly twenty to thirty years, so the age of the housing stock sets the baseline volume, and owner-occupancy rates matter because owners replace roofs while landlords defer them.
Is there room for another roofing contractor here, and what would it be worth?
What this market looks like nationally
We measured these from live business listings across six mid-size metros and from published federal business statistics. They are the yardstick every scan is scored against, so a city reading above or below them is the actual signal.
In a city of 250,000 that works out to roughly 130 roofing contractors sharing a market of about $57M a year. Your city will differ, which is the point of scanning it.
What the report shows
- Hail, wind and wildfire exposure by neighborhood, from federal hazard data.
- Owner-occupied housing counts and home age, the baseline replacement market.
- Competing roofers with review counts, including who has built real local reputation.
- Search demand for replacement separately from repair.
Every figure names its source and shows the arithmetic behind it, so you can argue with any input rather than taking a score on faith. See how the math is shown.
A real scan: Oklahoma City, OK
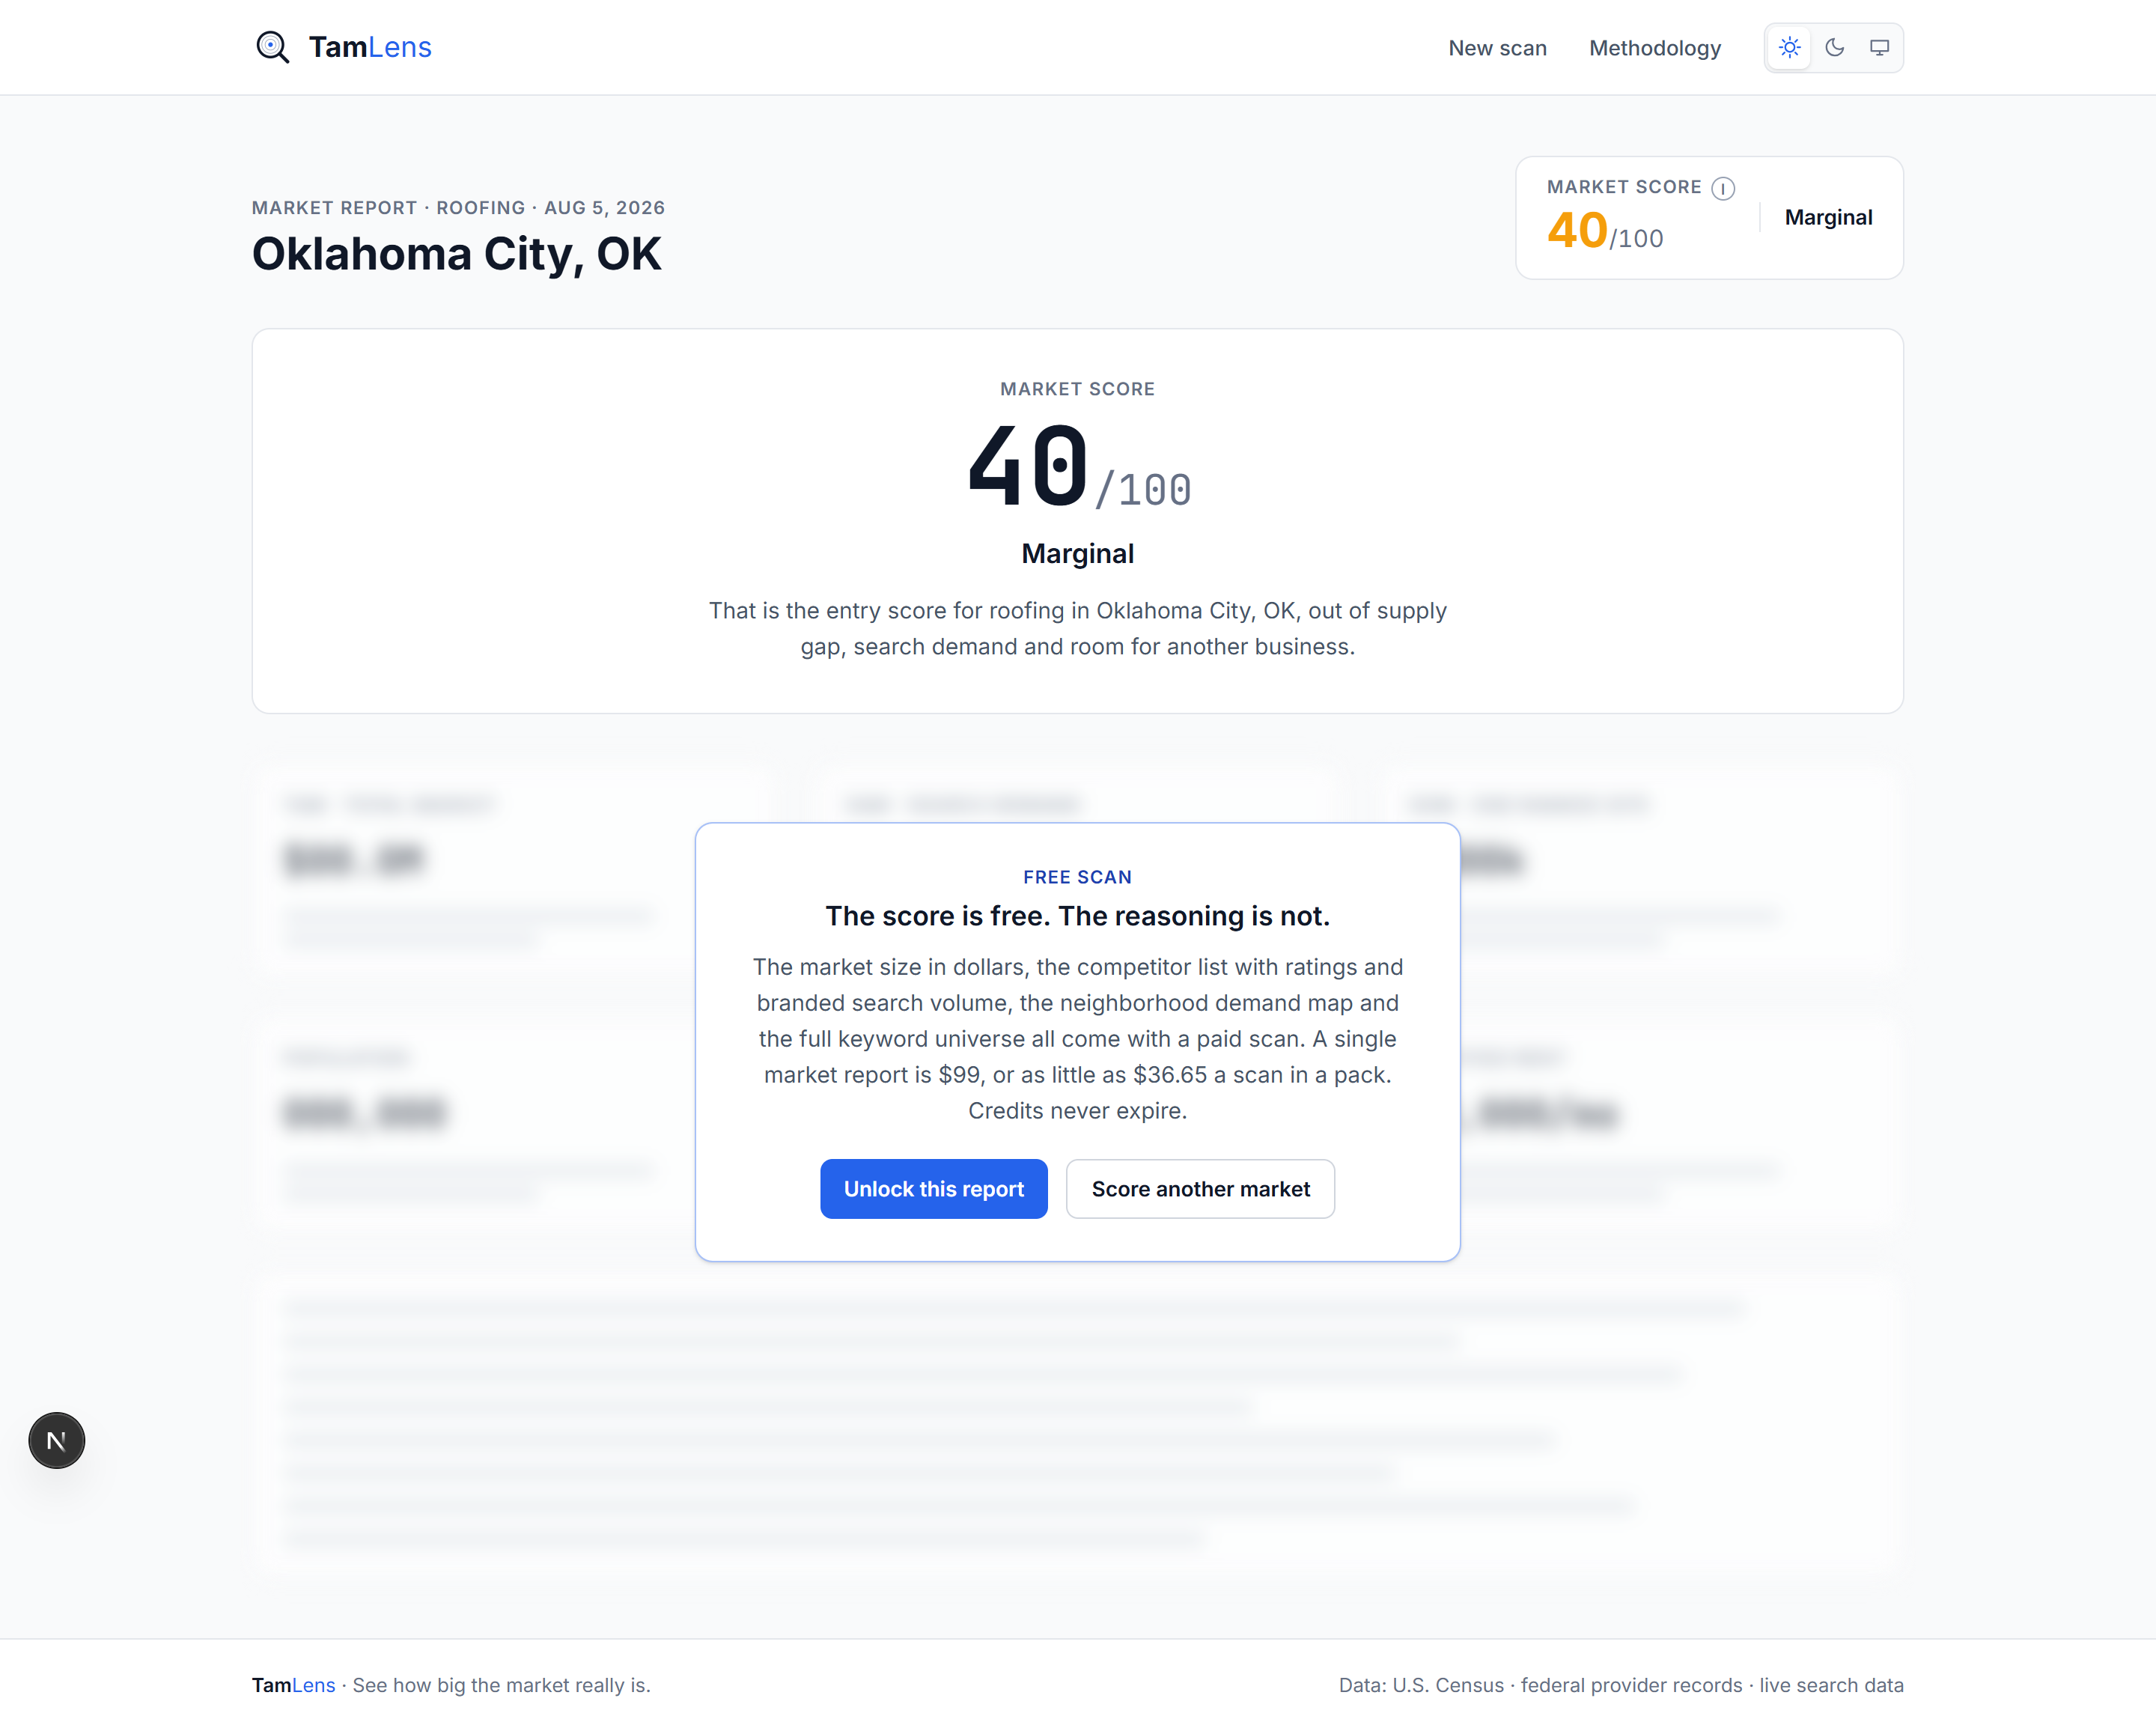
Hazard exposure by neighborhood
Who runs this scan
Roofing companies expanding into a neighboring metro, storm-chasing crews choosing a base, and operators building lead-generation sites in weather-exposed markets.
Common questions
Does it predict storms?
No, and be wary of anything that claims to. It reports measured hazard exposure by neighborhood, which tells you the standing risk profile of a market rather than what the weather will do next season.
Why is roofing revenue per business so high?
The published industry figure includes commercial roofing, which runs on much larger contracts than residential replacement. Read it as the category ceiling.
Is insurance work reflected?
Only indirectly, through hazard exposure and replacement demand. The report does not model claim rates or carrier behavior.