How this market works
Real estate is the most crowded local category on this list. Agent counts run far ahead of most trades, transactions are cyclical, and a large share of licensees do very little volume, so headline agent numbers overstate the real competition. The report counts brokerages from live listings rather than counting licensees, which is a truer read of who you would actually compete with.
Demand is set by household formation and turnover rather than by population alone. Neighborhood home values matter twice over, because they drive both the commission on a transaction and the kind of client the market produces.
Is there room for another brokerage here, and what would it be worth?
What this market looks like nationally
We measured these from live business listings across six mid-size metros and from published federal business statistics. They are the yardstick every scan is scored against, so a city reading above or below them is the actual signal.
In a city of 250,000 that works out to roughly 210 brokerages sharing a market of about $49M a year. Your city will differ, which is the point of scanning it.
What the report shows
- Home values and owner-occupancy by neighborhood.
- Competing brokerages with ratings and branded search volume.
- Search demand across buying, selling and rental intent.
- Household counts and median income, the base of transaction volume.
Every figure names its source and shows the arithmetic behind it, so you can argue with any input rather than taking a score on faith. See how the math is shown.
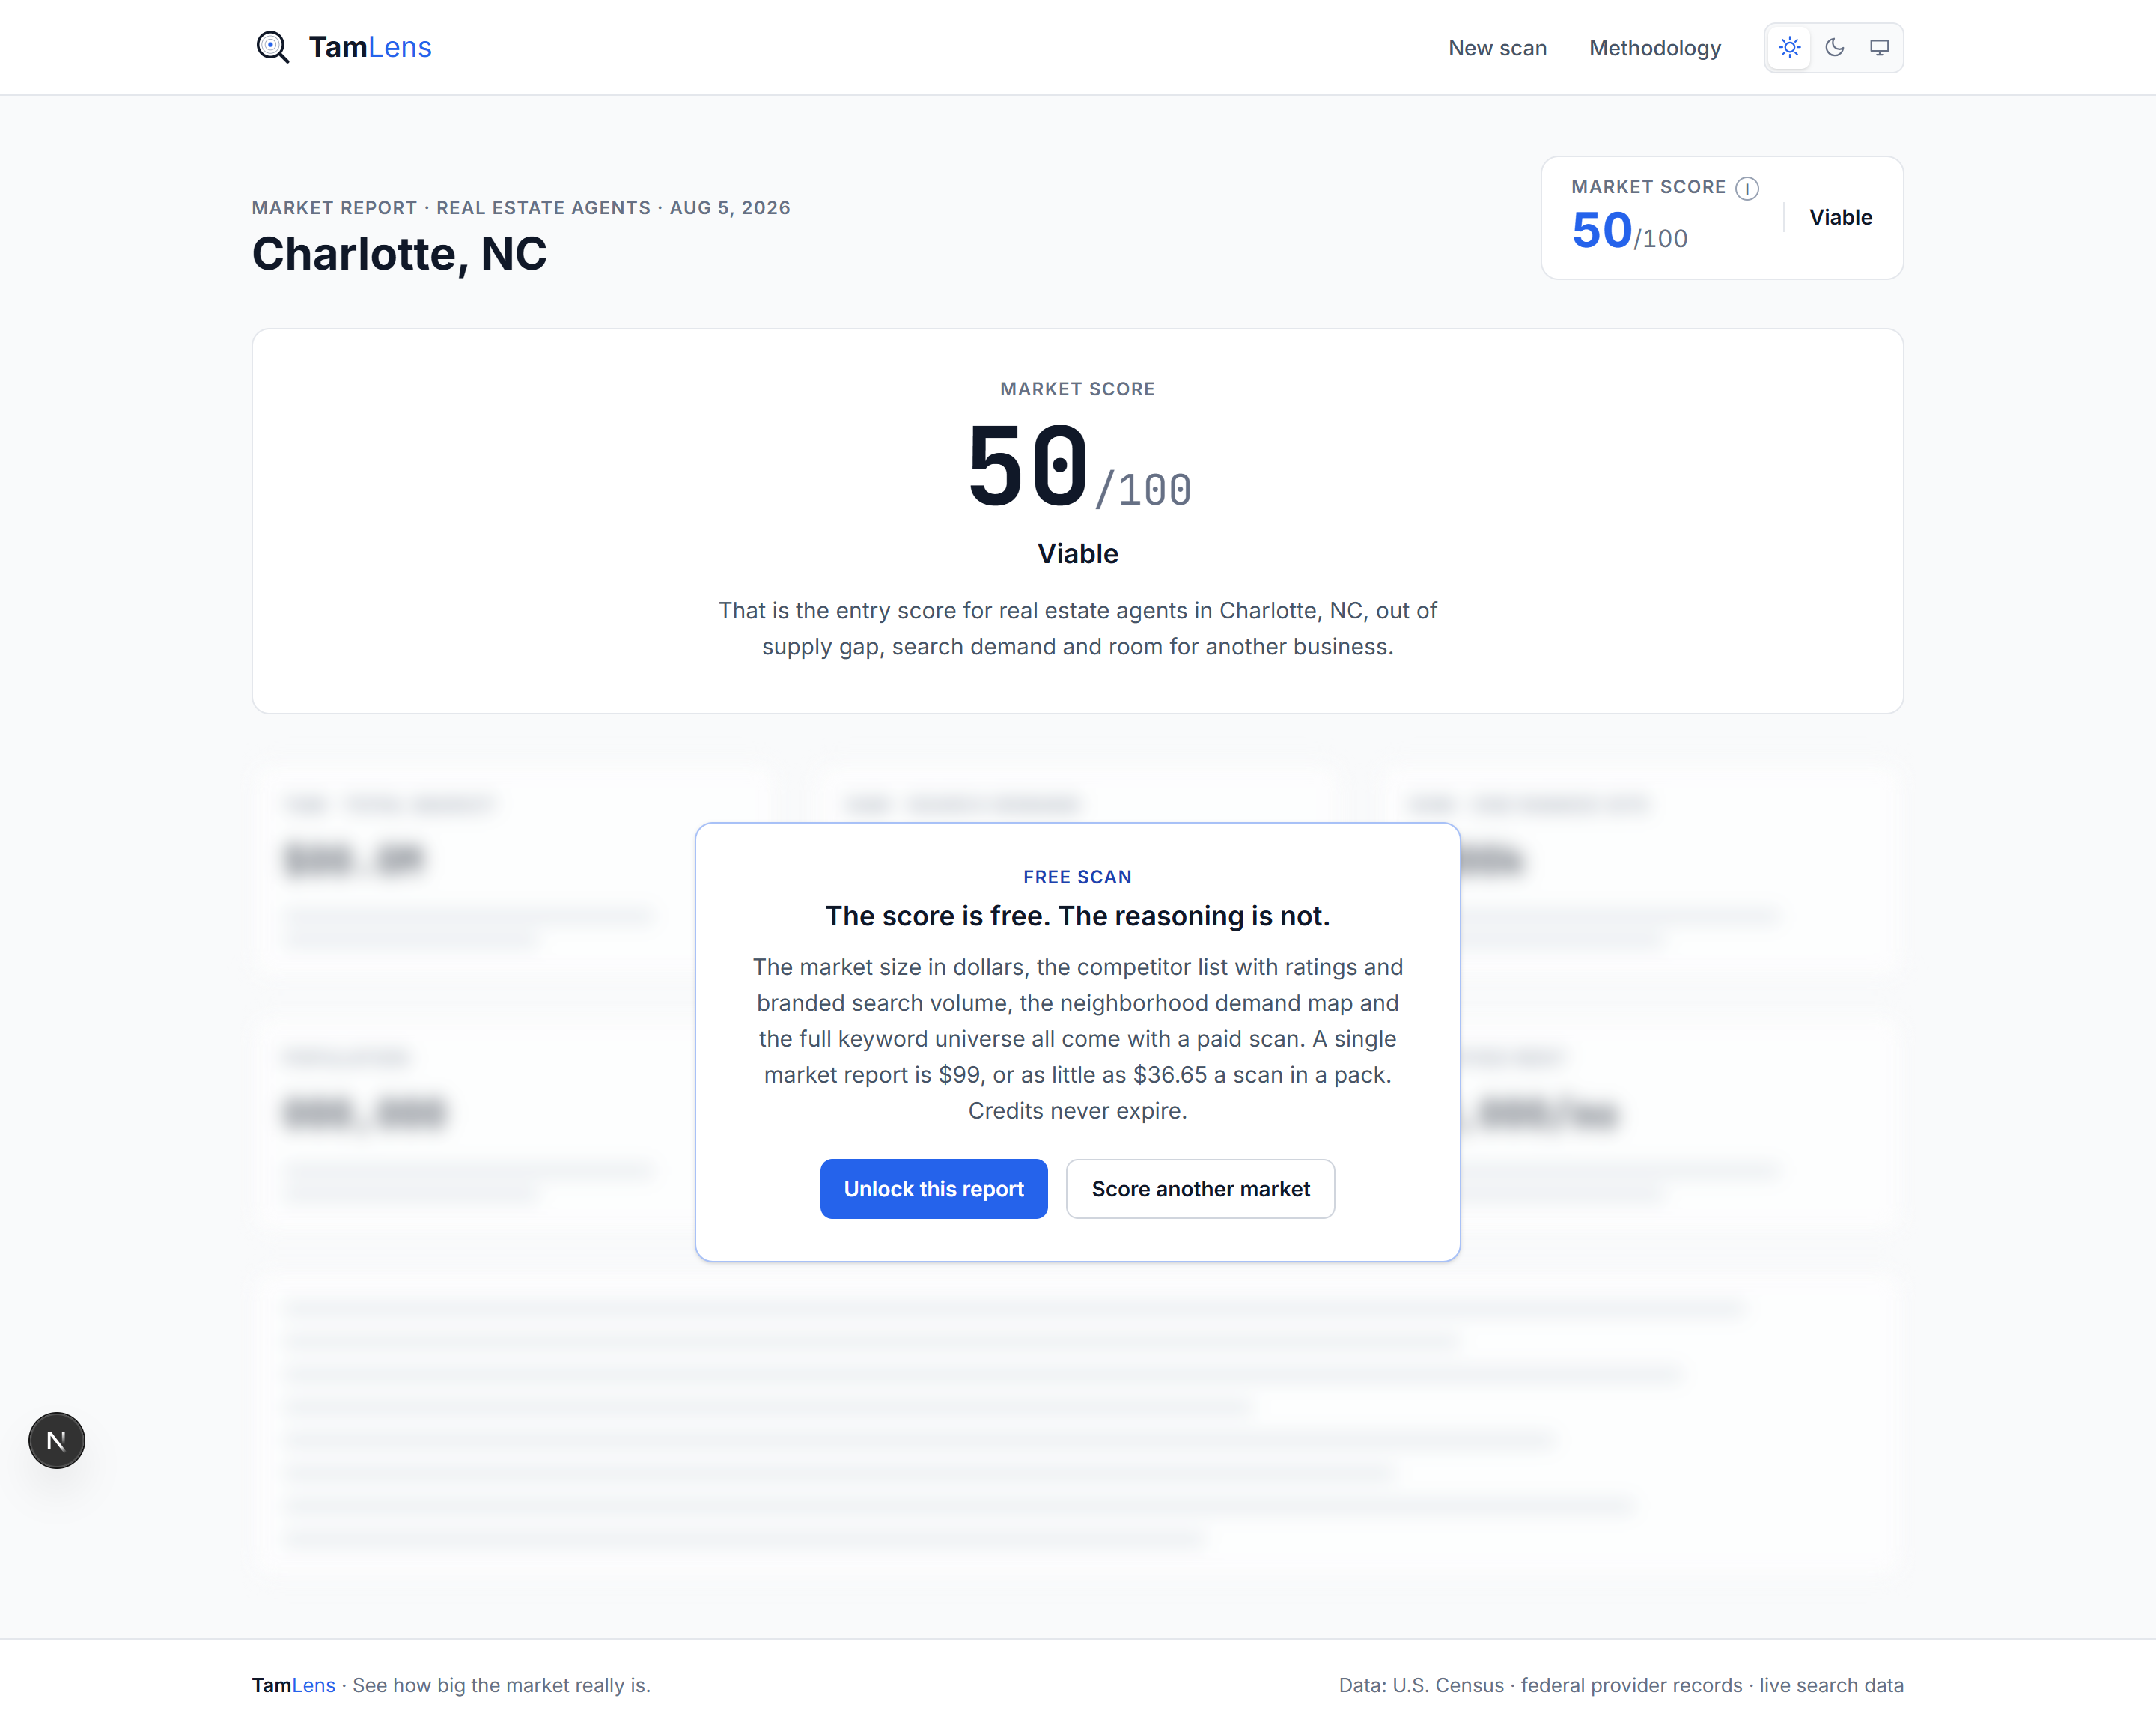
A real scan: Charlotte, NC
Who you would compete with
Who runs this scan
Brokerages opening an office, teams choosing a farm area, and agencies building real estate lead generation.
Common questions
Does this count agents or brokerages?
Brokerages. Counting licensed agents inflates the competitive picture, because a large share of licensees transact rarely or not at all.
Does it forecast home prices?
No. It reports current values and ownership patterns by neighborhood. Price forecasting is a different discipline and anything claiming to do both is worth a second look.
Is rental demand separated from sales?
In the keyword universe you can see rental and sales intent separately, which matters if you are weighing a property management arm.