How this market works
Plumbing demand is the steadiest of the trades because it is mostly non-deferrable. A failed water heater or a blocked main gets fixed the same week regardless of the economy, which makes the market less cyclical than remodeling or roofing but also harder to grow into: the work is already being done by someone.
That makes competitive density the number that decides entry, not demand. Older housing stock raises call volume per household, so the neighborhood view matters, but the deciding question is usually how many companies are already dividing up the work.
Is there room for another plumbing company here, and what would it be worth?
What this market looks like nationally
We measured these from live business listings across six mid-size metros and from published federal business statistics. They are the yardstick every scan is scored against, so a city reading above or below them is the actual signal.
In a city of 250,000 that works out to roughly 90 plumbing companies sharing a market of about $97M a year. Your city will differ, which is the point of scanning it.
What the report shows
- Households and housing age by neighborhood, the two things that set call volume.
- How many plumbing companies already work the area, and how established each one is by review count.
- Emergency search demand separately from routine, since emergency work carries the margin.
- Where the demand sits relative to where the competitors are.
Every figure names its source and shows the arithmetic behind it, so you can argue with any input rather than taking a score on faith. See how the math is shown.
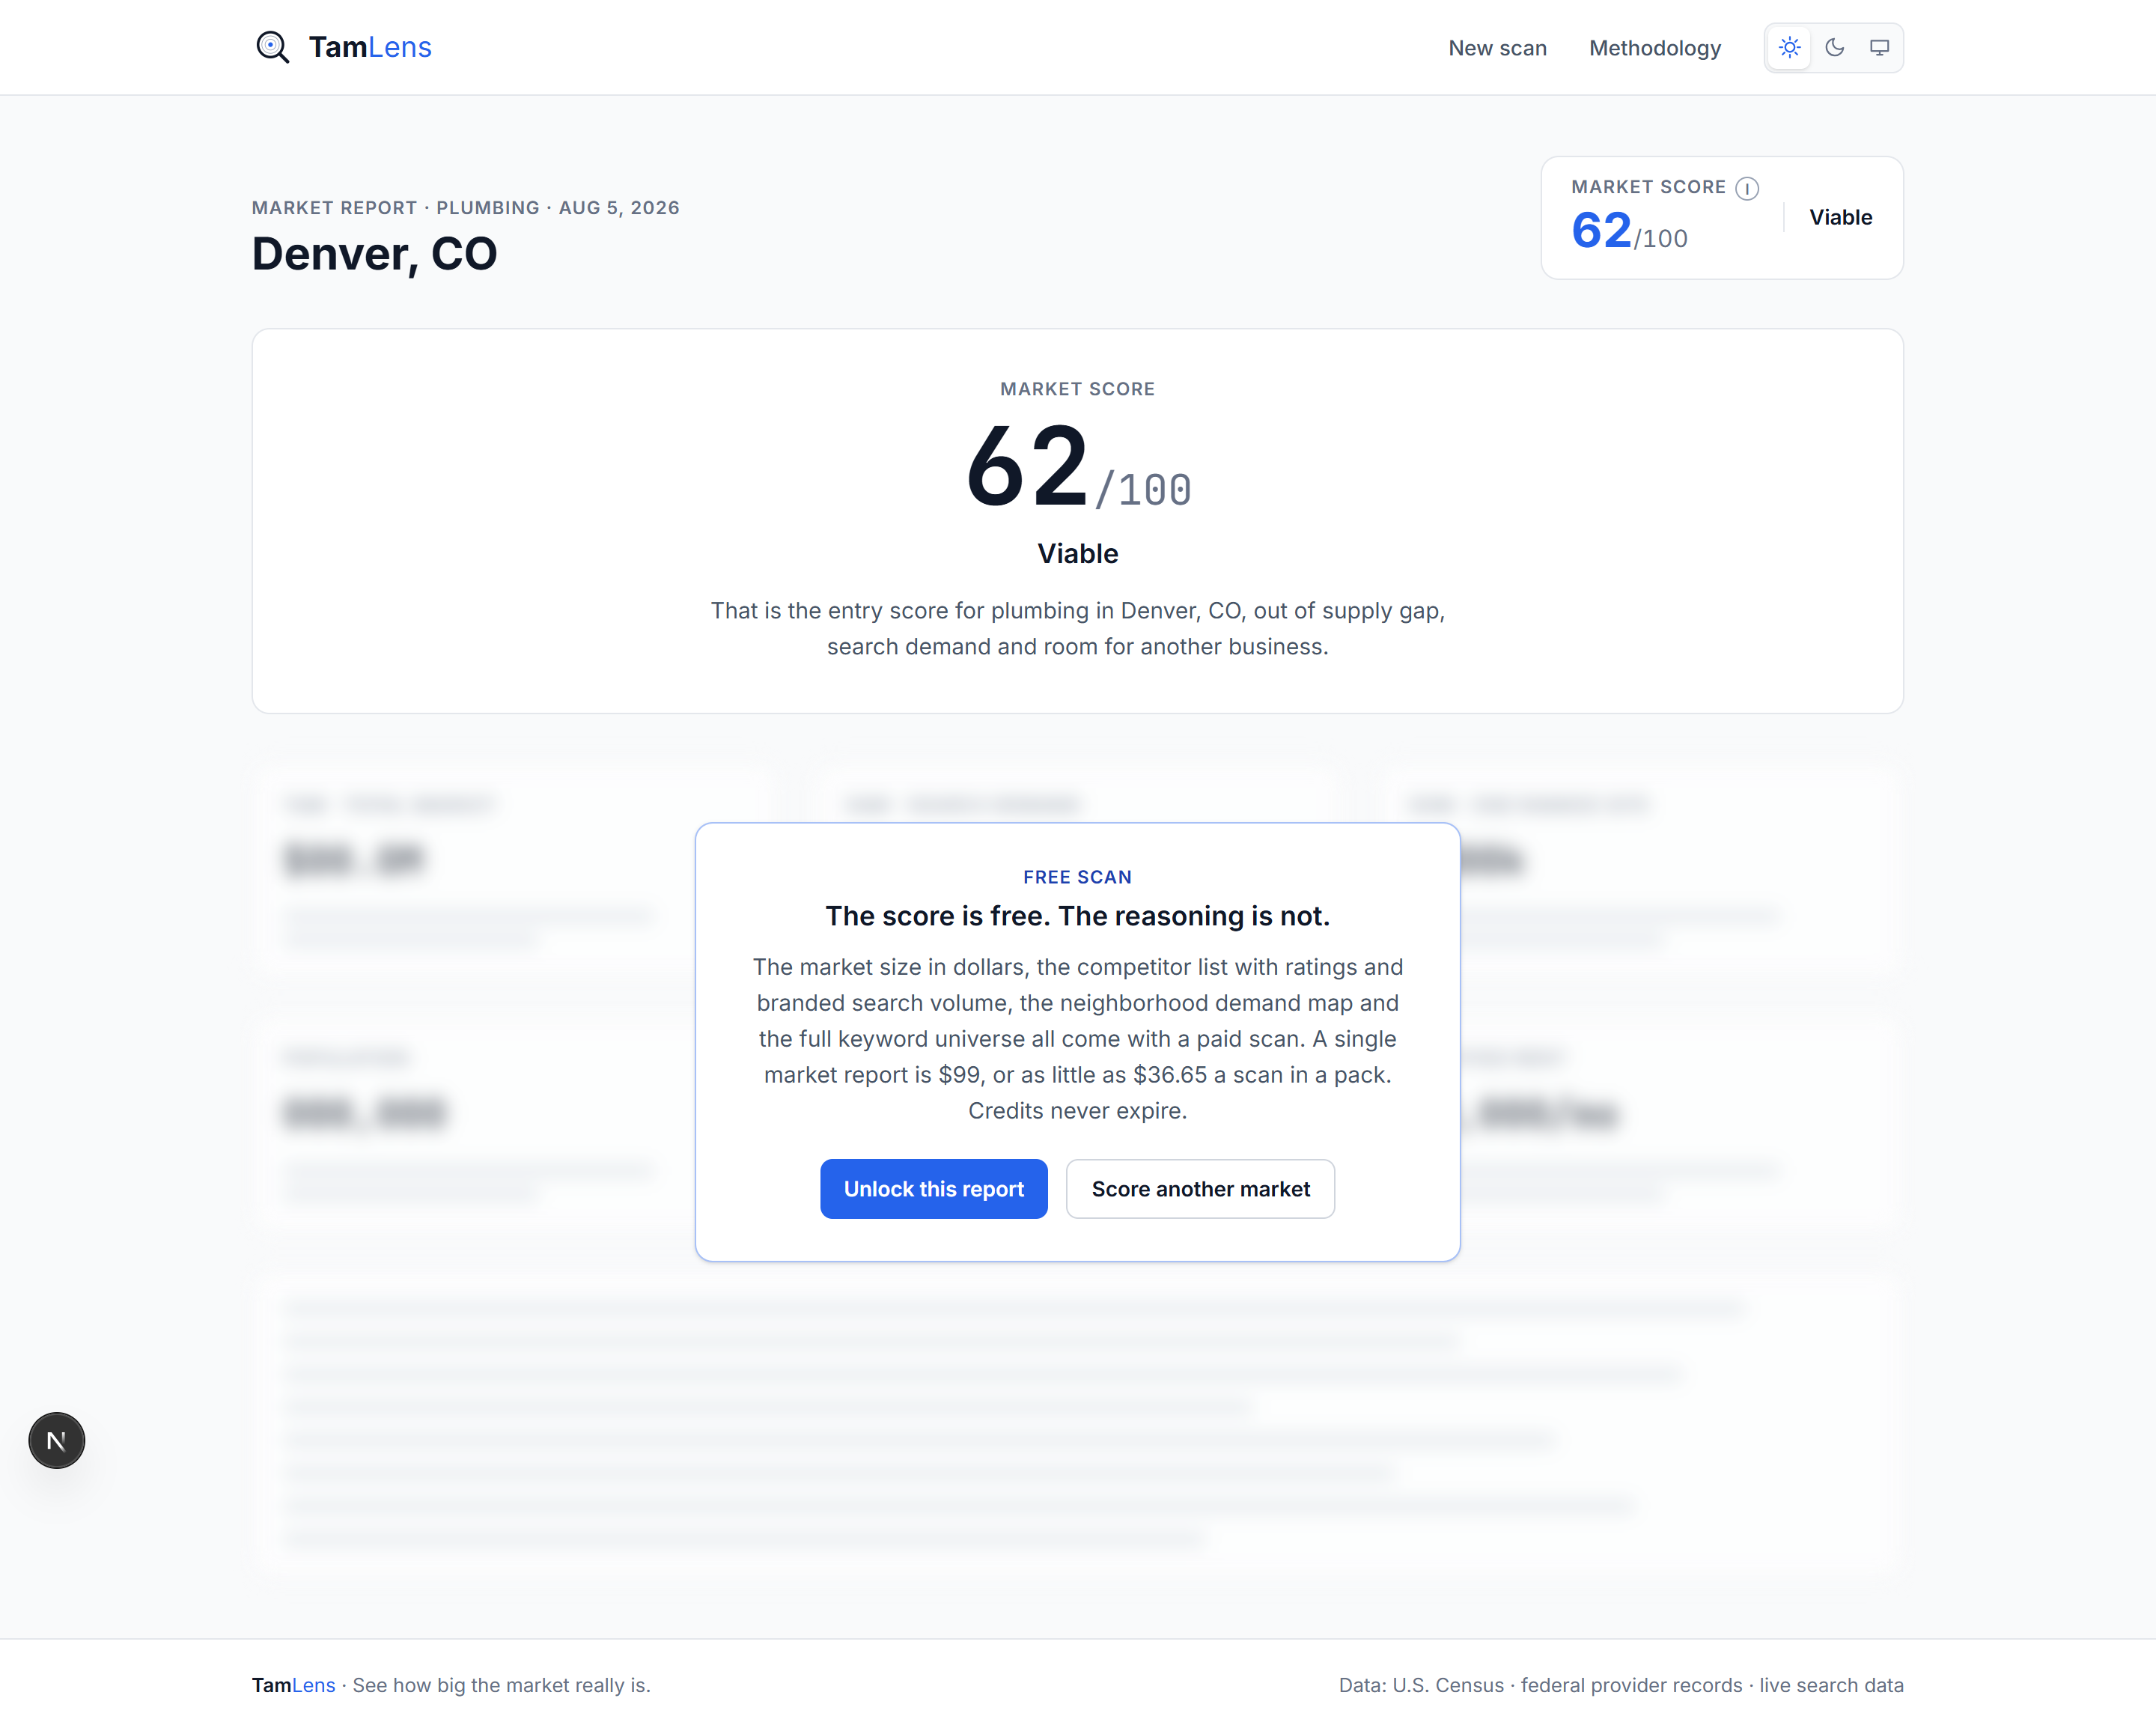
A real scan: Denver, CO
Where demand sits against competitors
Who runs this scan
Owners deciding whether to open a second location, buyers valuing an existing book, and lead-generation operators picking which metro to rank in.
Common questions
Is emergency demand separated from routine work?
The keyword universe splits them, so you can see emergency plumber volume next to drain cleaning and water heater terms. That split matters because emergency work prices very differently.
How current are the competitor counts?
They come from live business listings at scan time, not a static directory, so a company that opened last month is in the count.
Does the score punish a crowded market?
It reflects one, which is not the same thing. A dense market with high demand per resident can still score well. What lowers the score is density without the demand to support it.