How this market works
Auto repair demand is set by the vehicle parc rather than by people, and vehicles per household varies far more between metros than population does. A spread-out metro with two cars per household generates roughly double the work of a dense one at the same headcount, which is why a population-only read misleads badly in this category.
Repair is also the most road-dependent trade here. Shops draw from the commute rather than from the neighborhood, so measured traffic counts on nearby corridors matter more than the demographics of the immediate blocks.
Is there room for another repair shop here, and what would it be worth?
What this market looks like nationally
We measured these from live business listings across six mid-size metros and from published federal business statistics. They are the yardstick every scan is scored against, so a city reading above or below them is the actual signal.
In a city of 250,000 that works out to roughly 245 repair shops sharing a market of about $62M a year. Your city will differ, which is the point of scanning it.
What the report shows
- Measured vehicles per day on the roads around a candidate site.
- Competing shops with ratings and review counts.
- Search demand split across repair, brakes, oil change and transmission work.
- Neighborhood income, which shapes whether a market repairs or replaces.
Every figure names its source and shows the arithmetic behind it, so you can argue with any input rather than taking a score on faith. See how the math is shown.
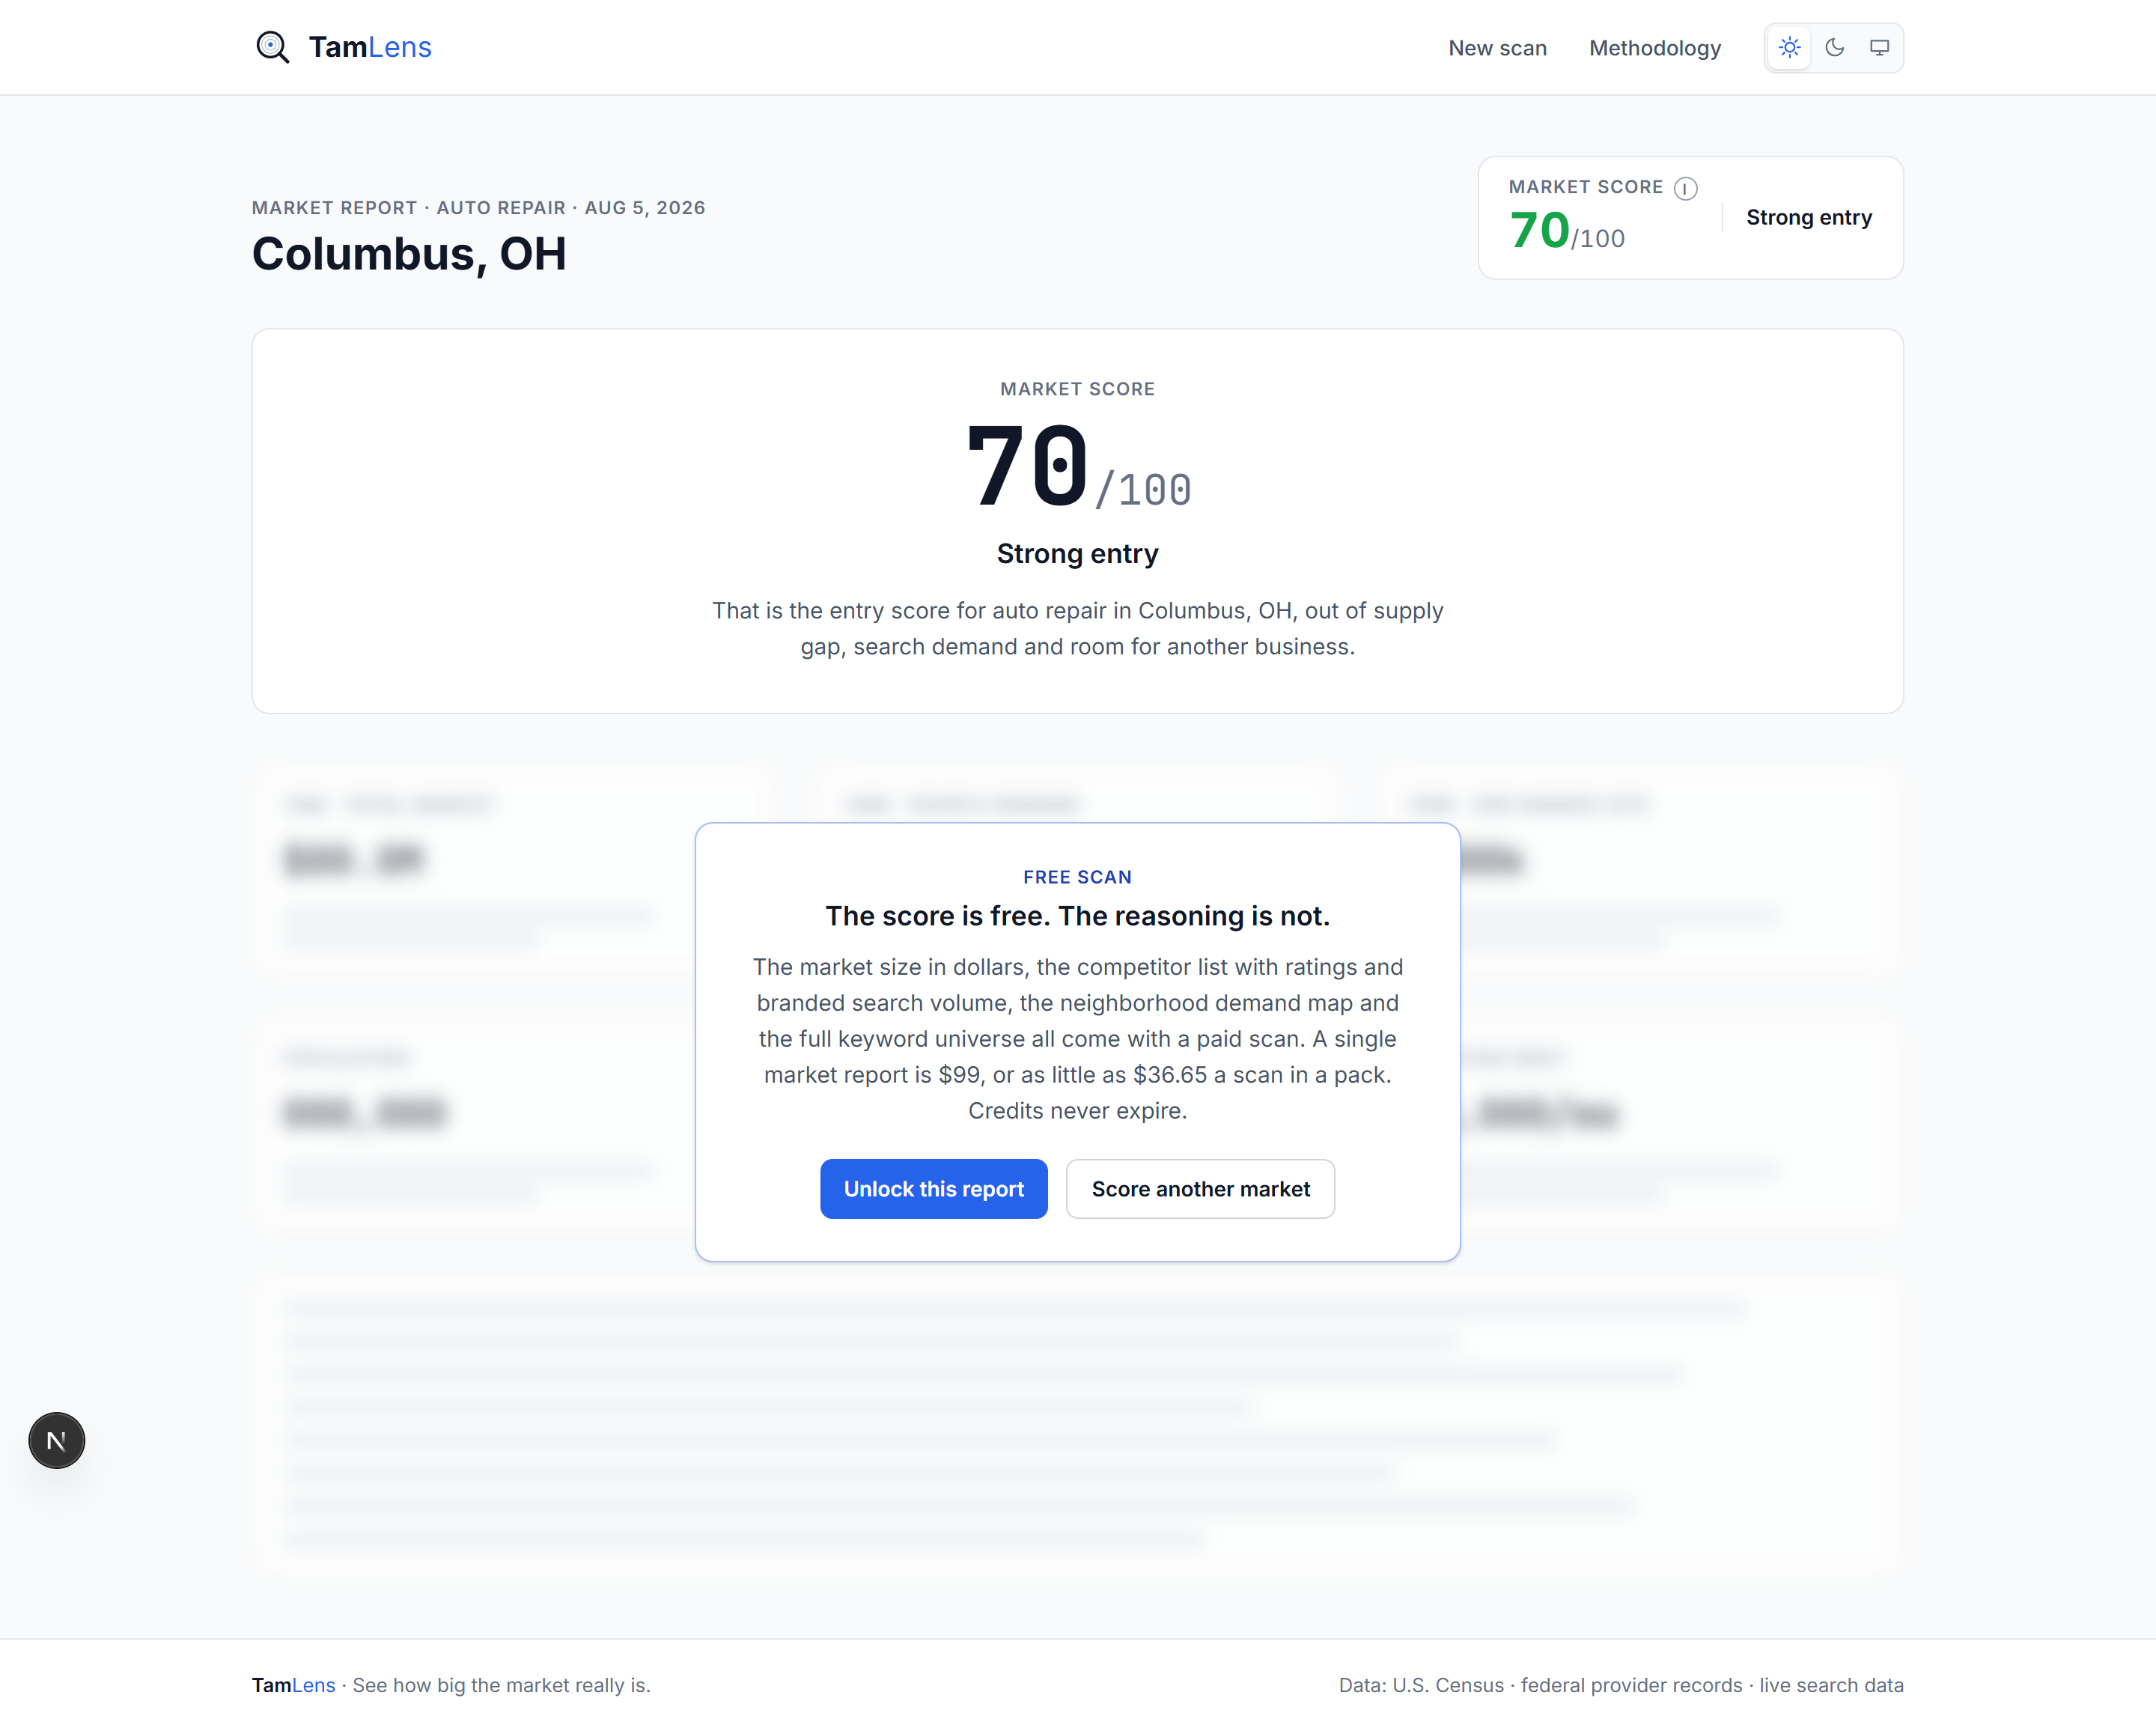
A real scan: Columbus, OH
Traffic past the door
Who runs this scan
Shop owners weighing a second bay or a second location, franchise buyers screening territories, and agencies building automotive lead generation.
Common questions
Does it separate general repair from specialties?
Yes. Auto body, tire, transmission, oil change, glass and detailing are each their own vertical, because the customer, the ticket and the competition differ.
Why do traffic counts matter so much here?
Because a repair shop draws from passing traffic and commute patterns rather than from the households immediately around it. A quiet street in a dense neighborhood is a worse site than a busy corridor in a thin one.
Is dealer service work counted?
No. The competitor count covers independent repair businesses, which is the market an independent shop actually competes in.